This work combines sensitivity analysis with heterogeneous time-series deep learning model prediction, which corresponds to the interpretations of Spatio-temporal features from what the model has actually learned. We forecast county-level COVID-19 infection using the Temporal Fusion Transformer (TFT). We then use the sensitivity analysis extending Morris Method to see how sensitive the outputs are with respect to perturbation to our static and dynamic input features. We have collected more than 2.5 years of socioeconomic and health features over 3142 US counties. Using the proposed framework, we conduct extensive experiments and show our model can learn complex interactions and perform predictions for daily infection at the county level.
Abstract: Deep Learning for Time-series plays a key role in AI for healthcare. To predict the progress of infectious disease outbreaks and demonstrate clear population-level impact, more granular analyses are urgently needed that control for important and potentially confounding county-level socioeconomic and health factors. We forecast US county-level COVID-19 infections using the Temporal Fusion Transformer (TFT). We focus on heterogeneous time-series deep learning model prediction while interpreting the complex spatiotemporal features learned from the data. The significance of the work is grounded in a real-world COVID-19 infection prediction with highly non-stationary, finely granular, and heterogeneous data. 1) Our model can capture the detailed daily changes of temporal and spatial model behaviors and achieves better prediction performance compared to other time-series models. 2) We analyzed the attention patterns from TFT to interpret the temporal and spatial patterns learned by the model. 3) We collected around 2.5 years of socioeconomic and health features for 3142 US counties, such as observed cases, and a number of static (age distribution and health disparity) and dynamic features (vaccination, disease spread, transmissible cases, and social distancing). Using the proposed framework, we have shown that our model can learn complex interactions. Interpreting different impacts at the county level would be crucial for understanding the infection process that can help effective public health decision-making.
Abstract: The COVID-19 pandemic has created unprecedented challenges for governments and healthcare systems worldwide, highlighting the critical importance of understanding the factors that contribute to virus transmission. This study aimed to identify the most influential age groups in COVID-19 infection rates at the US county level using the Modified Morris Method and deep learning for time-series. Our approach involved training the state-of-the-art time-series model Temporal Fusion Transformer on different age groups as a static feature and the population vaccination status as the dynamic feature. We analyzed the impact of those age groups on COVID-19 infection rates by perturbing individual input features and ranked them based on their Morris sensitivity scores, which quantify their contribution to COVID-19 transmission rates. The findings are verified using ground truth data from the CDC and US Census, which provide the true infection rates for each age group. The results suggest that young adults were the most influential age group in COVID-19 transmission at the county level between March 1, 2020 and November 27, 2021. Using these results can inform public health policies and interventions, such as targeted vaccination strategies, to better control the spread of the virus. Our approach demonstrates the utility of feature sensitivity analysis in identifying critical factors contributing to COVID-19 transmission and can be applied in other public health domains.
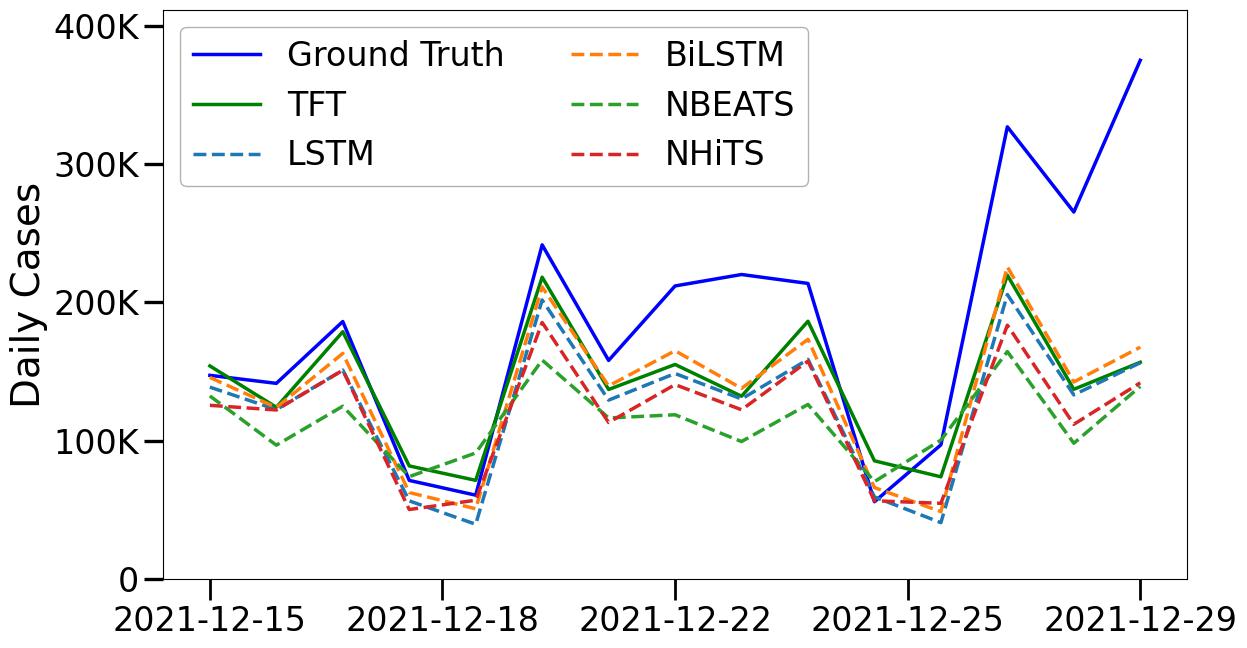
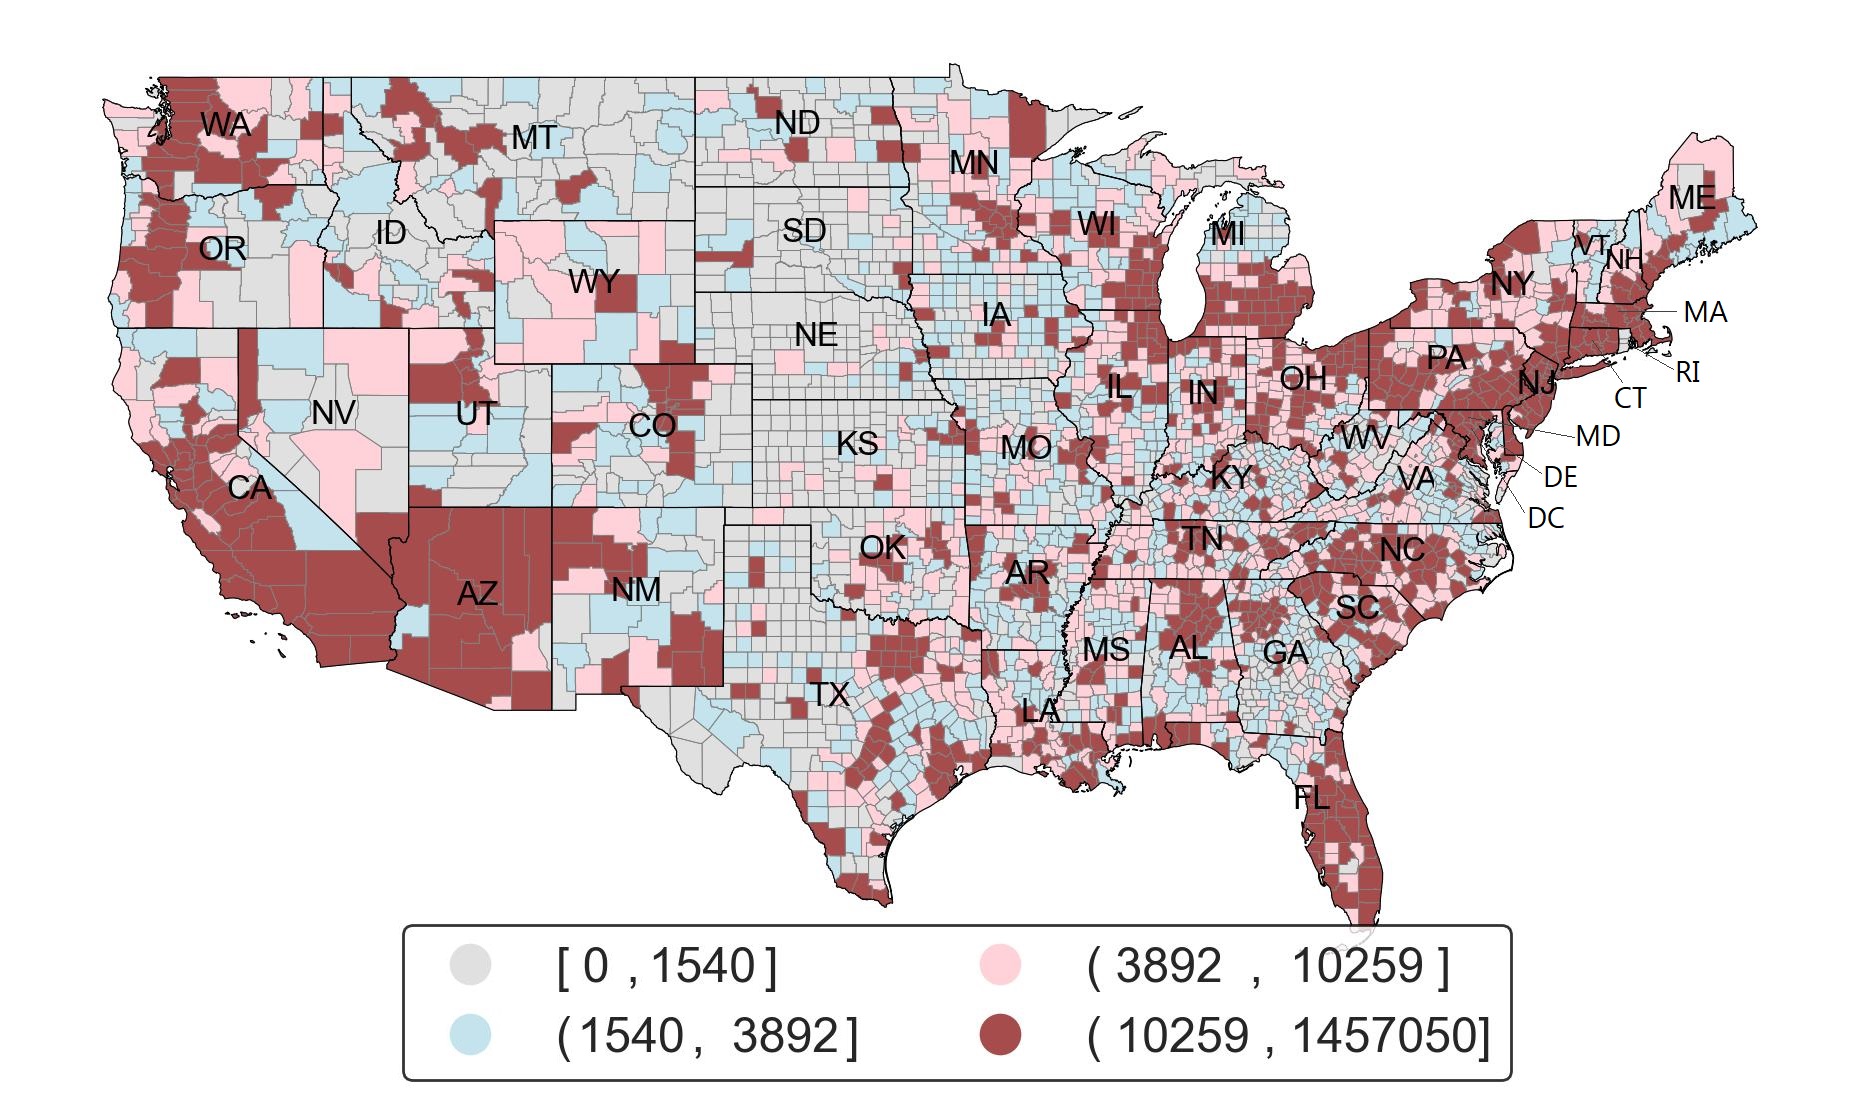
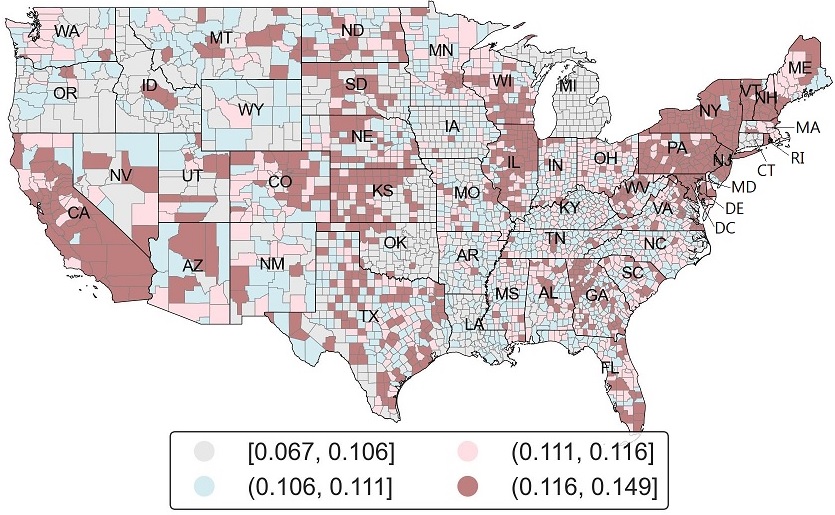
Click counties on the below U.S. map to see how our model captures spatial patterns across urban and rural counties. Data comes from our test split between 12-15-2021 and 12-29-2021. Heatmap is based on the ground-truth total sum of counties. Or Type in the County Name and State Name to see the one you are interested in! please be in the format of {State, County} e.g: Virginia, Madison
You can find our Github repo here
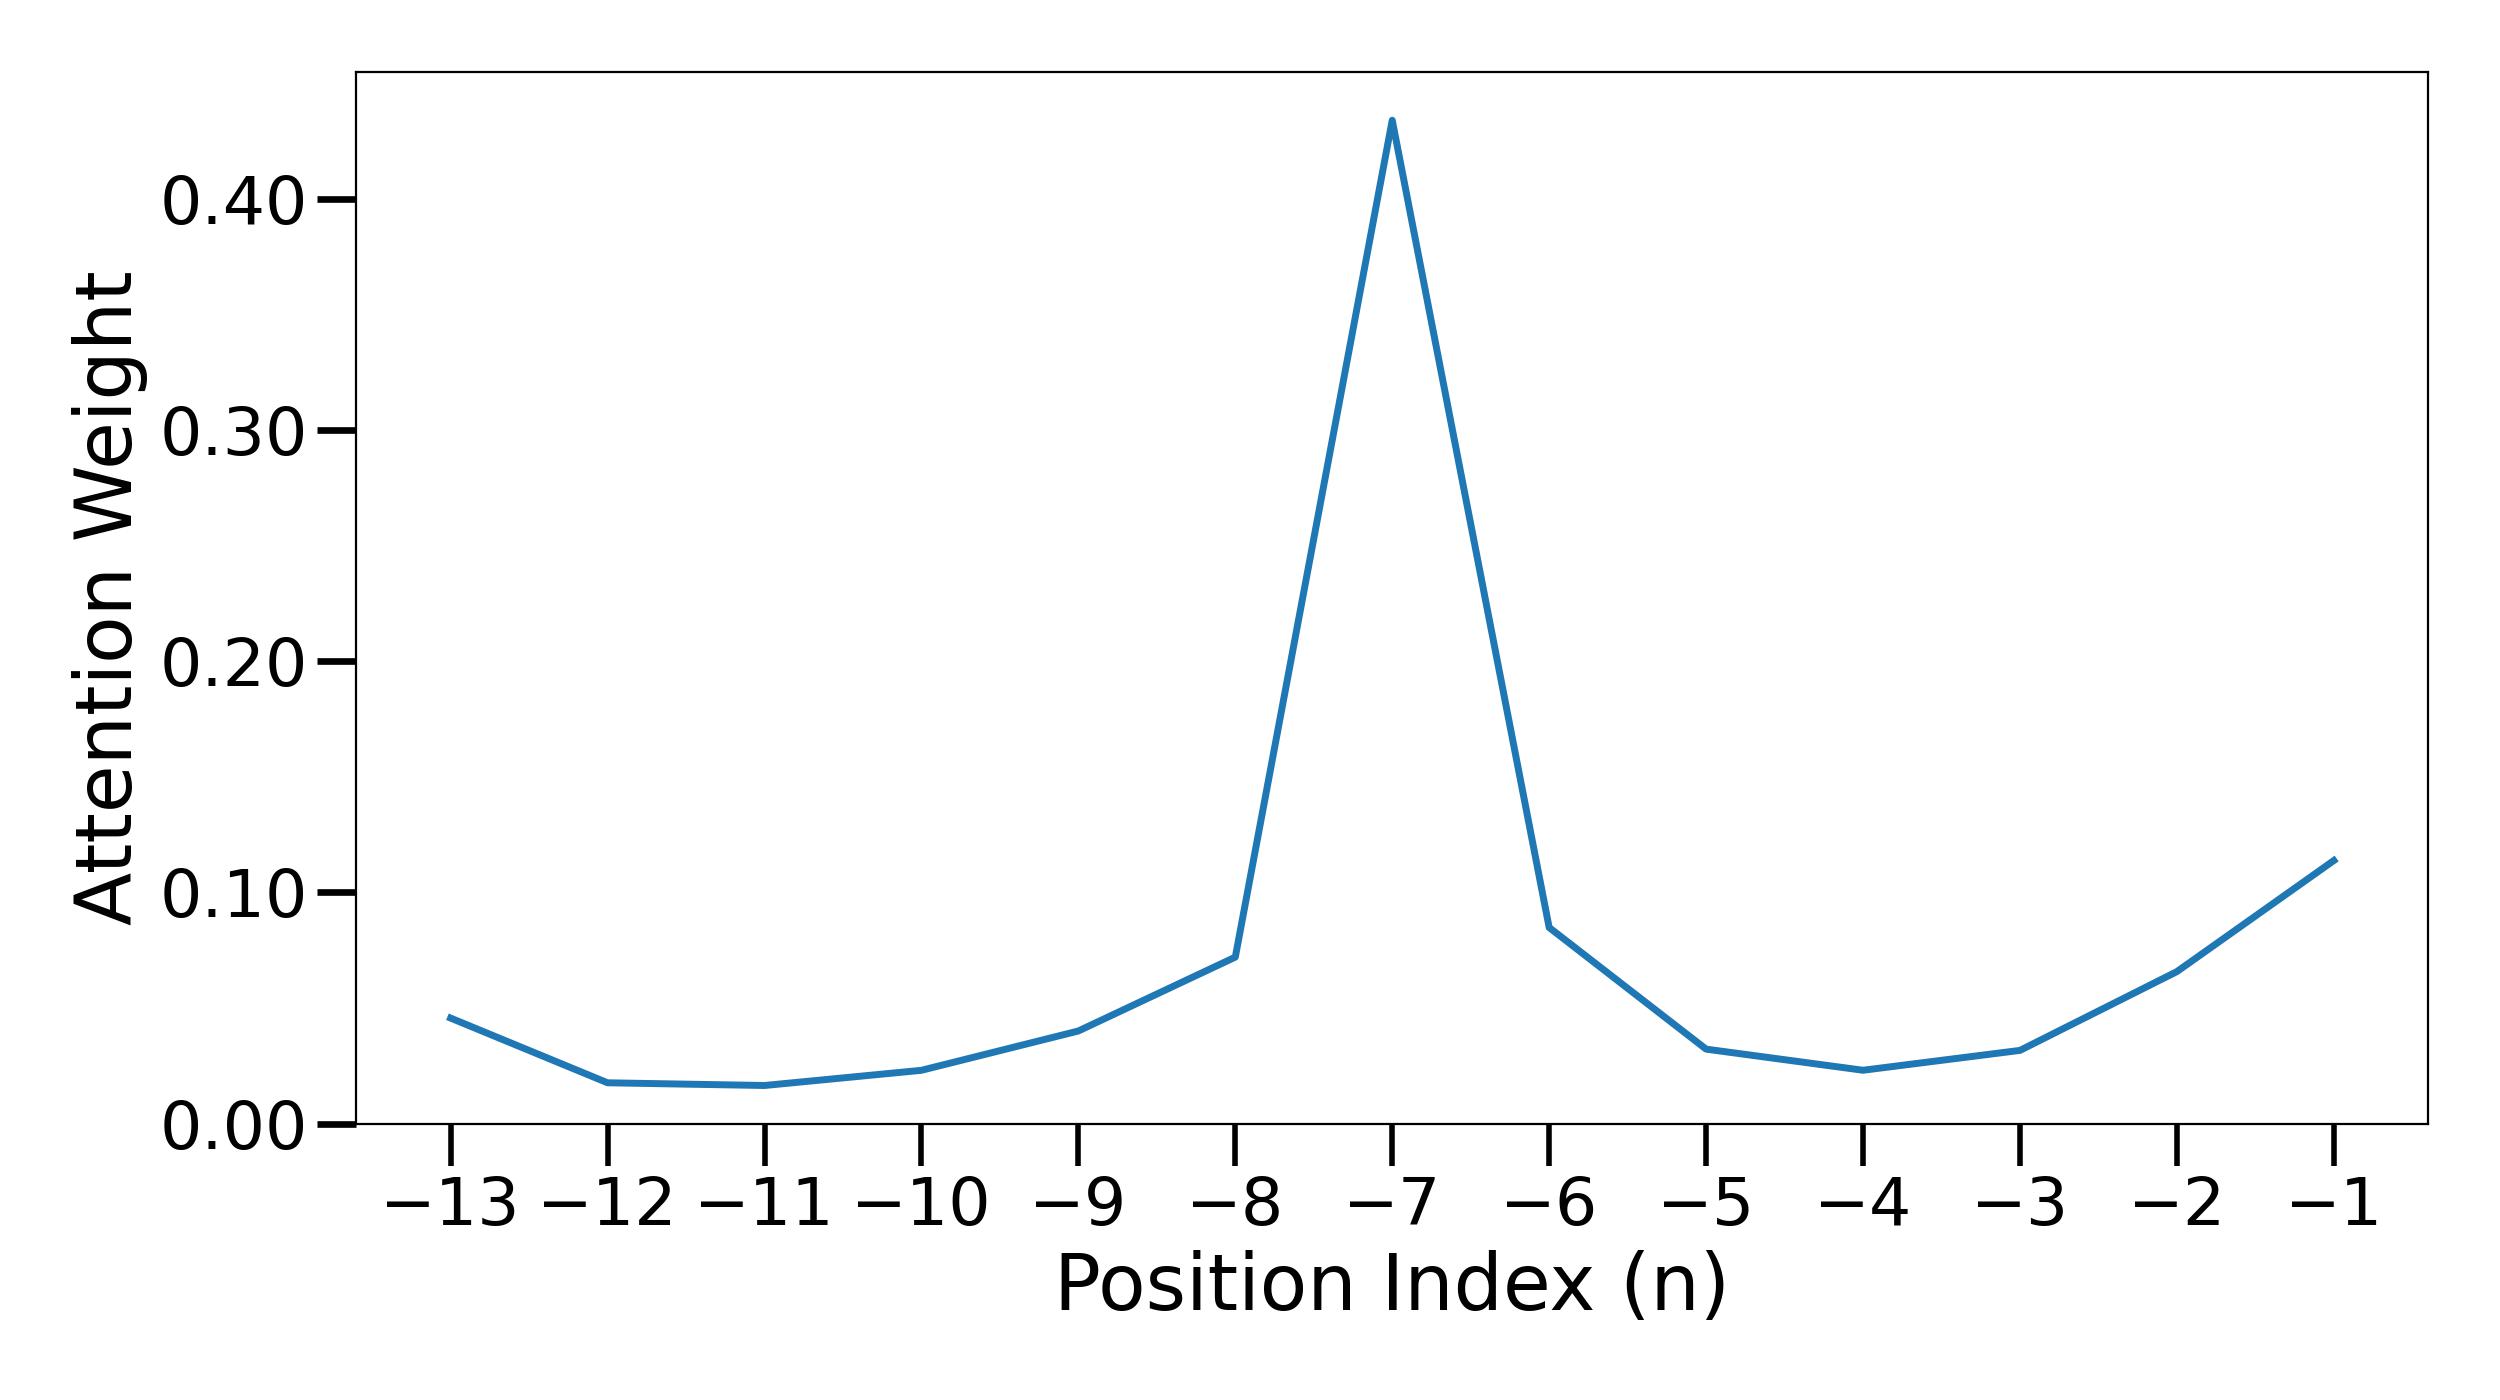
Note that, past values of target and known futures are also used as observed inputs by TFT.
| Feature | Type | Update Frequency | Description/Rationale | Source(s) |
|---|---|---|---|---|
| Age Distribution (% of age 65 and over) | Static | Once | Aged 65 or Older from 2016-2020 American Community Survey (ACS). Older ages have been associated with more severe outcomes from COVID-19 infection. | 2020 SVI |
| Health Disparities (Uninsured) | Percentage uninsured in the total civilian noninstitutionalized population estimate, 2016- 2020 ACS. Individuals without insurance are more likely to be undercounted in infection statistics, and may have more severe outcomes due to lack of treatment. | 2020 SVI | ||
| Transmissible Cases | Observed | Daily | Cases from the last 14 days per 100k population. Because of the 14-day incubation period, the cases identified in that time period are the most likely to be transmissible. This metric is the number of such "contagious" individuals relative to the population, so a greater number indicates more likely continued spread of disease. | USA Facts, 2020 SVI (for population estimate) |
| Disease Spread | Cases that are from the last 14 days (one incubation period) divided by cases from the last 28 days . Because COVID-19 is thought to have an incubation period of about 14 days, only a sustained decline in new infections over 2 weeks is sufficient to signal reduction in disease spread. This metric is always between 0 and 1, with values near 1 during exponential growth phase, and declining linearly to zero over 14 days if there are no new infections. | USA Facts | ||
| Social Distancing | Unacast social distancing scoreboard grade is assigned by looking at the change in overall distance travelled and the change in nonessential visits relative to baseline (previous year), based on cell phone mobility data. The grade is converted to a numerical score, with higher values being less social distancing (worse score) is expected to increase the spread of infection because more people are interacting with other. | Unacast | ||
| Vaccination Full Dose (Series_Complete_Pop_Pct) |
Percent of people who are fully vaccinated (have second dose of a two-dose vaccine or one dose of a single-dose vaccine) based on the jurisdiction and county where recipient lives. | CDC | ||
| SinWeekly | Known Future | Sin (day of the week / 7) . | Date | |
| CosWeekly | Cos (day of the week / 7) . | |||
| Case | Target | COVID-19 infection at county level. | USA Facts |